HiQ Distributed Tracing
Distributed tracing is the capability for a tracing solution to track and observe service requests as they flow through distributed systems by collecting data as the requests go from one service to another. The trace data helps you understand the flow of requests through your microservices environment and pinpoint where failures or performance issues are occurring in the system—and why.
OpenTelemetry

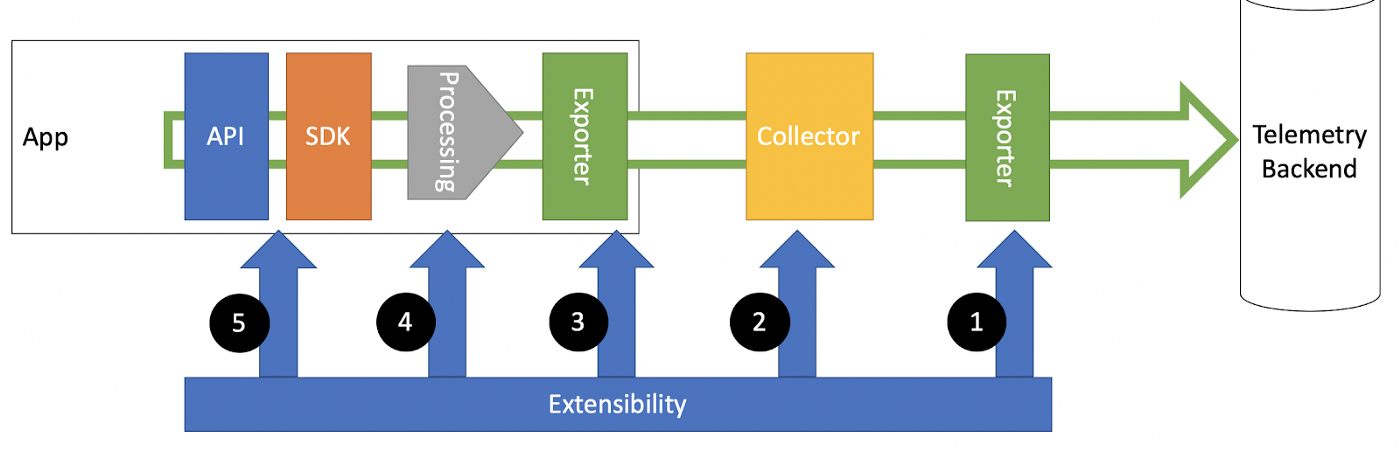
OpenTelemetry is a set of APIs, SDKs, tooling and integrations that are designed for the creation and management of telemetry data such as traces, metrics, and logs. It is vendor neutral, so it doesn’t specify implementation details like Jaeger or Zipkin. OpenTelemetry provides default implementations for all the tracing backends and vendors, while allowing users to choose a different implementation for vendor specific features.
HiQ supports OpenTelemetry out of the box by context manager HiQOpenTelemetryContext.
To get OpenTelemetry and the code examples in this chapter working, install both the opentelemetry API and SDK:
pip install opentelemetry-api
pip install opentelemetry-sdk
The API package provides the interfaces required by the application owner, as well as some helper logic to load implementations. The SDK provides an implementation of those interfaces. The implementation is designed to be generic and extensible enough that in many situations, the SDK is sufficient. You won’t use them directly but it is needed by HiQ.
Jaeger
Jaeger, inspired by Dapper and OpenZipkin, is a distributed tracing platform created by Uber Technologies and donated to Cloud Native Computing Foundation. It can be used for monitoring microservices-based distributed systems:
Distributed context propagation
Distributed transaction monitoring
Root cause analysis
Service dependency analysis
Performance / latency optimization
https://www.jaegertracing.io/
HiQ supports Jaeger out of the box too.
Set Up
The following is an example which assume you have jaeger server/agent running locally. If you don’t have, you can run the command to start a docker instance for jaeger server:
docker run --rm --name hiq_jaeger \
  -e COLLECTOR_ZIPKIN_HOST_PORT=:9411 \
  -p 5775:5775/udp \
  -p 6831:6831/udp \
  -p 6832:6832/udp \
  -p 5778:5778 \
  -p 16686:16686 \
  -p 14268:14268 \
  -p 14250:14250 \
  -p 9411:9411 \
  jaegertracing/all-in-one
The target code is the same as before:
1 2 3 4 5 6 7 8 9 10 11 12 13 14 15 16 17 18 19 20 | import time def func1(): time.sleep(1.5) print("func1") func2() def func2(): time.sleep(2.5) print("func2") def main(): func1() if __name__ == "__main__": main() |
Jeager supports two protocols: thrift and protobuf.
Thrift + HiQ
Below is the driver code for thrift. You can see the only change is line 4 and 10. You only need to add a context manager hiq.distributed.HiQOpenTelemetryContext to get the jaeger tracing working.
1 2 3 4 5 6 7 8 9 10 11 12 13 14 15 16 17 | import os import hiq from hiq.distributed import HiQOpenTelemetryContext, OtmExporterType here = os.path.dirname(os.path.realpath(__file__)) def run_main(): with HiQOpenTelemetryContext(exporter_type=OtmExporterType.JAEGER_THRIFT): driver = hiq.HiQLatency(f"{here}/hiq.conf") hiq.mod("main").main() driver.show() if __name__ == "__main__": run_main() |
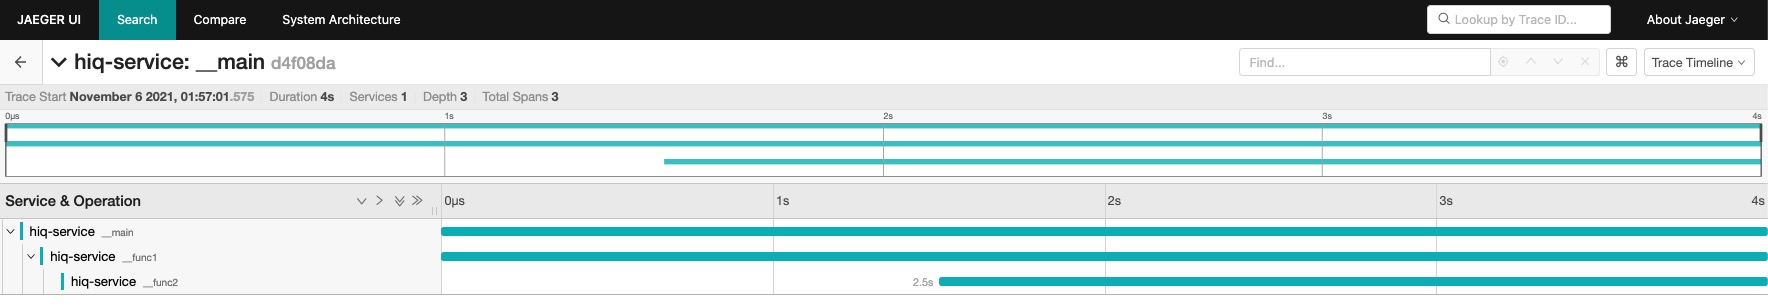
Run the driver code and check Jaeger UI at http://localhost:16686, you can see the traces have been recorded:
Protobuf + HiQ
Protobuf works the same way. You just need to replace OtmExporterType.JAEGER_THRIFT with OtmExporterType.JAEGER_PROTOBUF. This exporter always sends traces to the configured agent using Protobuf via gRPC.
1 2 3 4 5 | def run_main(): with HiQOpenTelemetryContext(exporter_type=OtmExporterType.JAEGER_PROTOBUF): driver = hiq.HiQLatency(f"{here}/hiq.conf") hiq.mod("main").main() driver.show() |
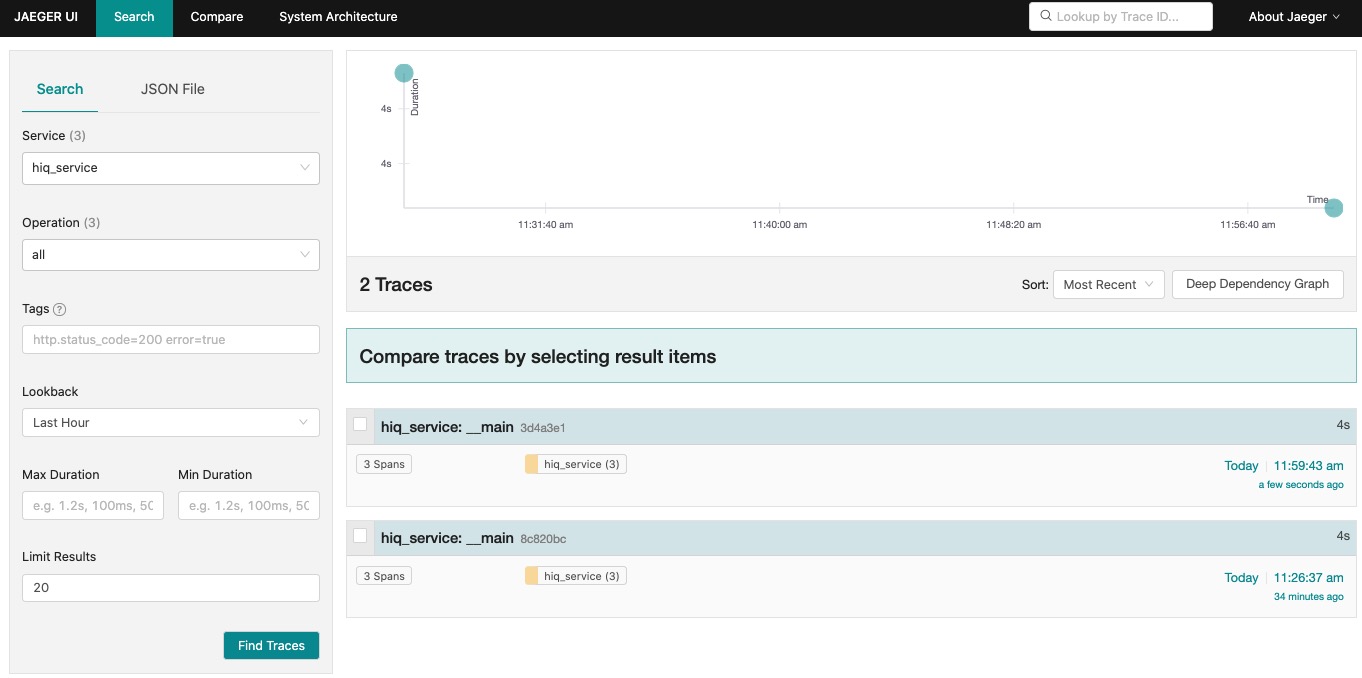
Run the driver code, and refresh Jaeger UI. We can see a new trace appears in Jaeger UI:
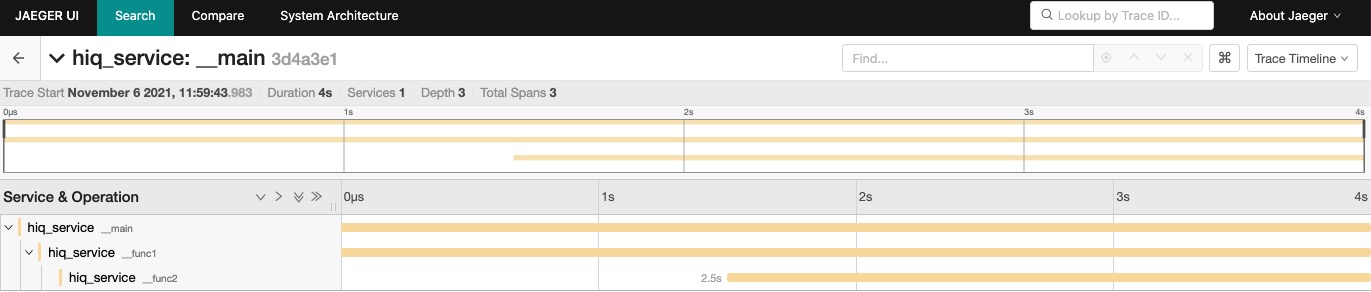
Click the new trace and we can see:
ZipKin
HiQ allows exporting of OpenTelemetry traces to Zipkin. This sends traces to the configured Zipkin collector endpoint using:
JSON over HTTP with support of multiple versions (v1, v2)
HTTP with support of v2 protobuf
Set Up
The quickest way to start a Zipkin server is to fetch the latest released server as a self-contained executable jar. Note that the Zipkin server requires minimum JRE 8. For example:
$ curl -sSL https://zipkin.io/quickstart.sh | bash -s
$ java -jar zipkin.jar
If everything is fine, you should see a Zipkin logo like:
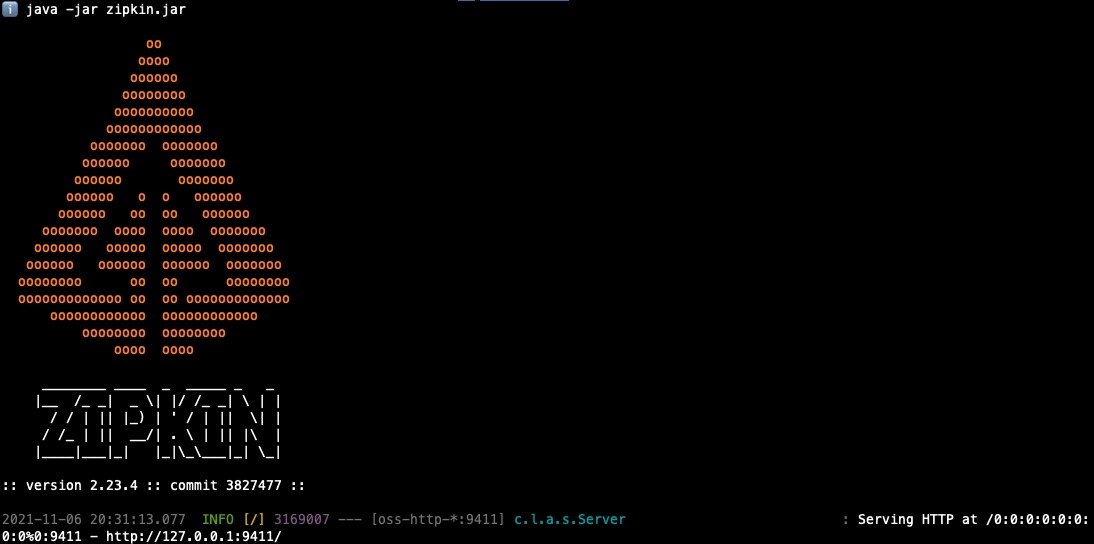
Note
You can use the Jaeger server (port 9411) we launched too. But according to my test, it only works for JSON + HTTP mode, not Protobuf mode. However, the official Zipkin server works for both modes. Get the latest version at: https://github.com/openzipkin/zipkin.
The target code is the same as before.
JSON + HTTP + HiQ
1 2 3 4 5 6 7 8 9 10 11 12 13 14 15 16 17 | import os import hiq from hiq.distributed import HiQOpenTelemetryContext, OtmExporterType here = os.path.dirname(os.path.realpath(__file__)) def run_main(): with HiQOpenTelemetryContext(exporter_type=OtmExporterType.ZIPKIN_JSON): driver = hiq.HiQLatency(f"{here}/hiq.conf") hiq.mod("main").main() driver.show() if __name__ == "__main__": run_main() |
Run the driver code and check the Zipkin web UI.
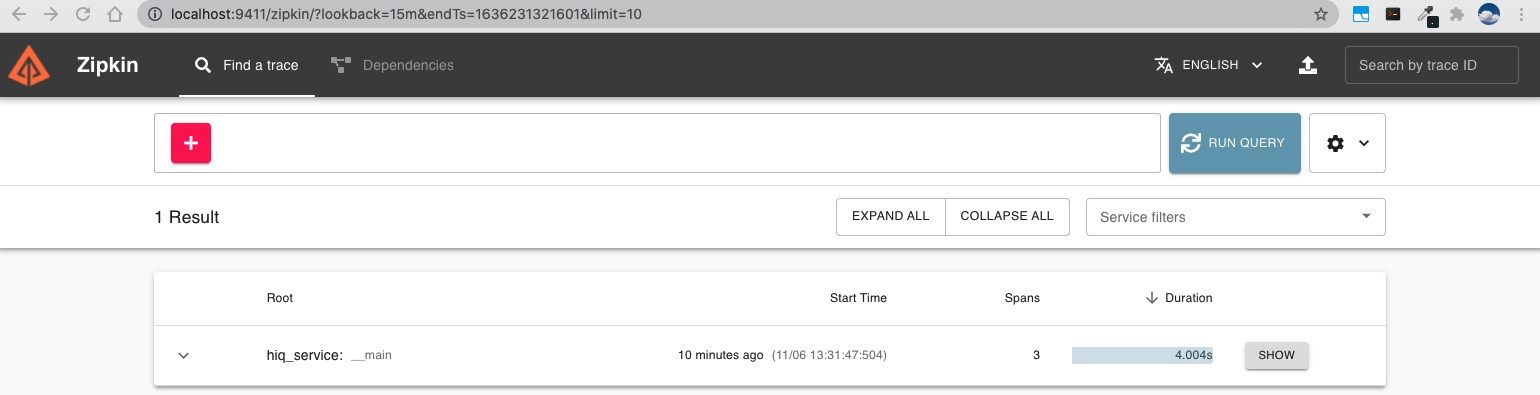
Click the SHOW button and we can see:
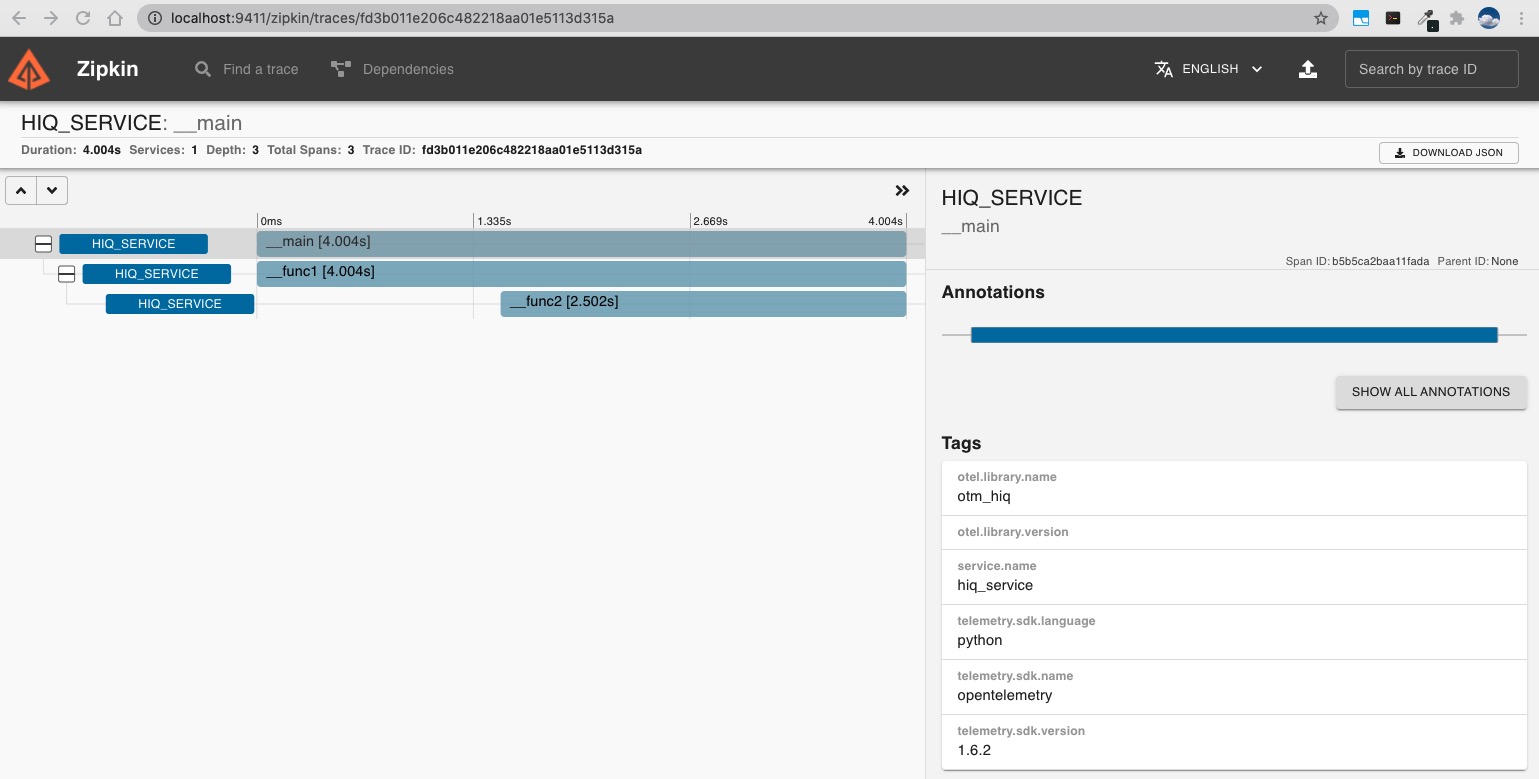
The default endpoint is http://localhost:9411/api/v2/spans. If there is a different endpoint xxx, you should add endpoint='xxx' as one of HiQOpenTelemetryContext’s arguments in the constructor.
Protobuf + HiQ
1 2 3 4 5 6 7 8 9 10 11 12 13 14 15 16 17 | import os import hiq from hiq.distributed import HiQOpenTelemetryContext, OtmExporterType here = os.path.dirname(os.path.realpath(__file__)) def run_main(): with HiQOpenTelemetryContext(exporter_type=OtmExporterType.ZIPKIN_PROTOBUF): driver = hiq.HiQLatency(f"{here}/hiq.conf") hiq.mod("main").main() driver.show() if __name__ == "__main__": run_main() |
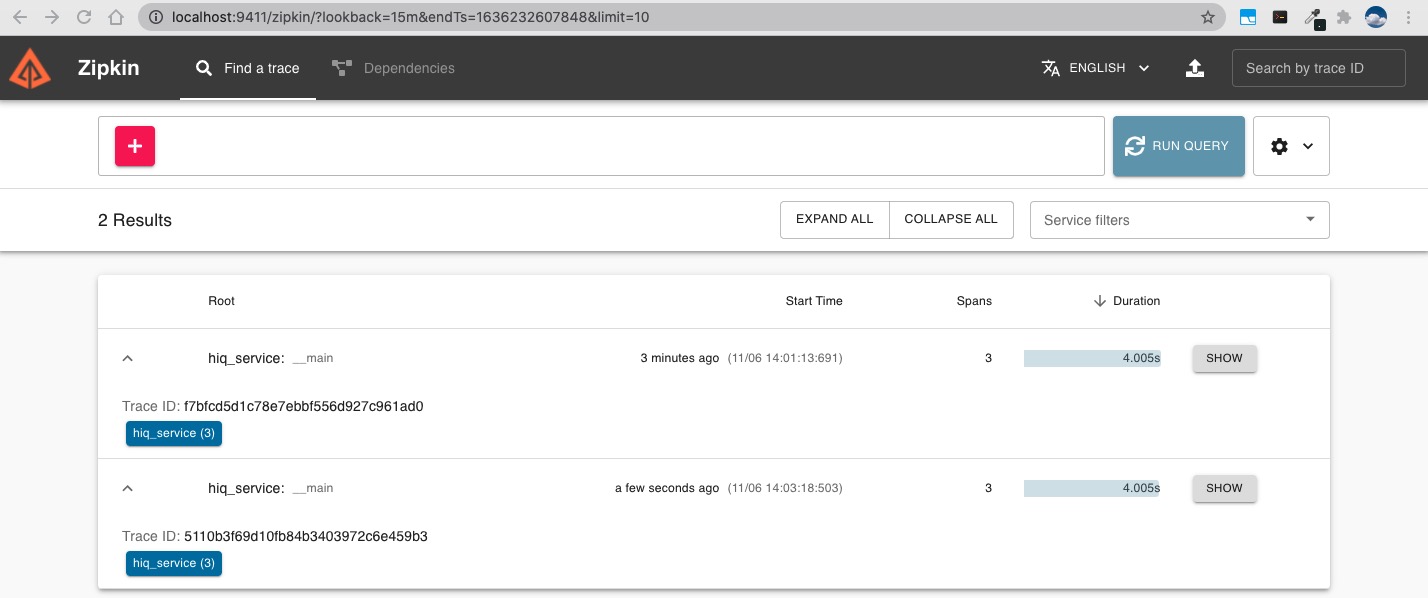
Run the driver code and check the Zipkin web UI. We can see a new trace has been recorded.
Ray
Installation
pip install ray
Dask
Installation
pip install dask