HiQ Vendor Integration
OCI APM
OCI Application Performance Monitoring (APM) is a service that provides deep visibility into the performance of applications and enables DevOps professionals to diagnose issues quickly in order to deliver a consistent level of service.
HiQ supports OCI APM out of the box.
Get APM Endpoint and Environments Setup
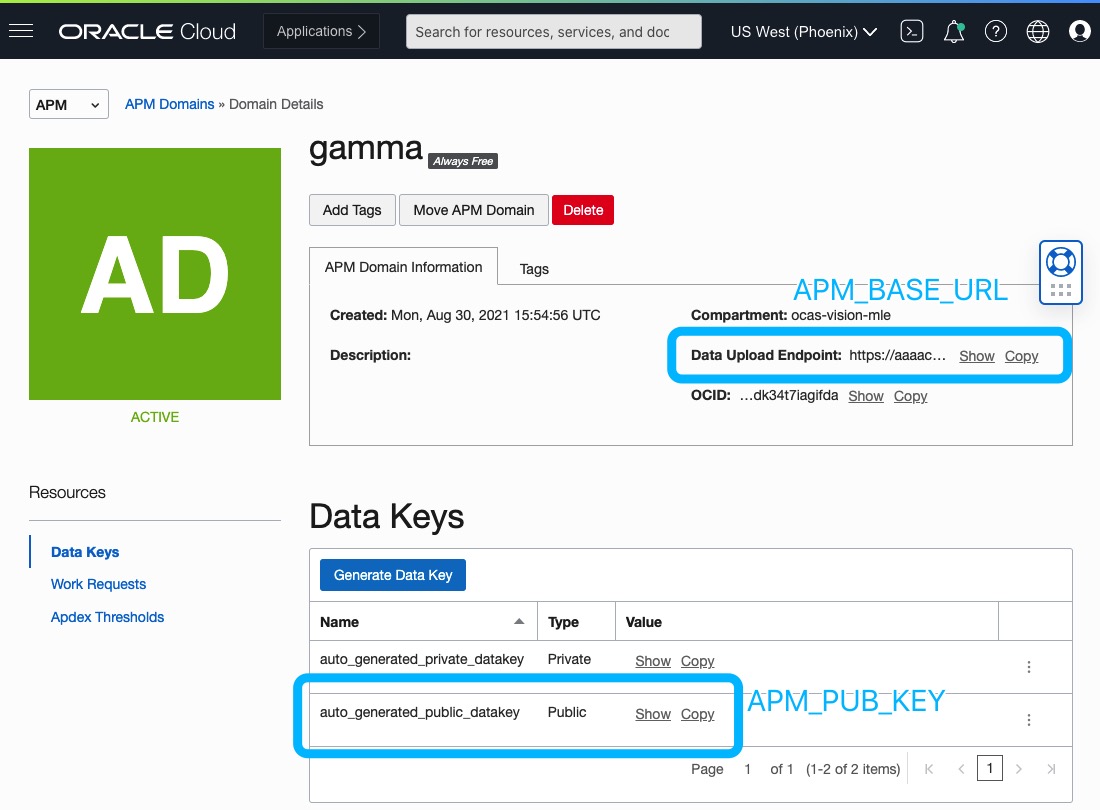
To use Oracle APM, we need to have the APM server’s endpoint. To get the endpoint, you should copy your own APM_BASE_URL
and APM_PUB_KEY
from OCI web console and set them as environment variables.
APM_BASE_URL
is the Data Upload Endpoint
in APM Domains
page; APM_PUB_KEY
is the public key named auto_generated_public_datakey
in the same page. You can just click the word show
to copy them.
Warning
The values below are fake and for demo purposes only. You should replace them with your own APM_BASE_URL and APM_PUB_KEY.
Then you can set them in the terminal like:
export APM_BASE_URL="https://aaaac64xyvkaiaaaxxxxxxxxxx.apm-agt.us-phoenix-1.oci.oraclecloud.com" export APM_PUB_KEY="JL6DVW2YBYYPA6G53UG3ZNAJSHSBSHSN"Tip
“The public key and public channel supposed to be used by something like a browser in which any end user may see the key. For server side instrumentation you should use the private data key. Changing this will make no difference in any way. The idea is that you may want/need to change the public key more often.”
–Avi Huber
You can also set it in your python code programmatically with
os.environ
like what we have done in previous chapter.
There are two ways to use OCI APM in HiQ. The legacy way is to use
HiQOciApmContext
which usespy_zipkin
under the hood. The modern way is to useHiQOpenTelemetryContext
, which uses the newOpenTelemetry
api.HiQOciApmContext
The first way to send data to OCI APM is to use
HiQOciApmContext
. To useHiQOciApmContext
, you need to installpy_zipkin
:pip install py_zipkinA Quick Start Demo
With the two environment variables set, we can write the following code:
1 2 3 4 5 6 7 8 9 10 11 12 13 14 15 16 17 18 import os import time from hiq.vendor_oci_apm import HiQOciApmContext def fun(): with HiQOciApmContext( service_name="hiq_test_apm", span_name="fun_test", ): time.sleep(5) print("hello") if __name__ == "__main__": os.environ["TRACE_TYPE"] = "oci-apm" fun()Run this code you can see the result in APM trace explorer.
Monolithic Application Performance Monitoring
Just like before, we have the same target code.
1 2 3 4 5 6 7 8 9 10 11 12 13 14 15 16 17 18 19 20 import time def func1(): time.sleep(1.5) print("func1") func2() def func2(): time.sleep(2.5) print("func2") def main(): func1() if __name__ == "__main__": main()This is the driver code:
1 2 3 4 5 6 7 8 9 10 11 12 13 14 15 16 17 18 19 20 import hiq import os from hiq.vendor_oci_apm import HiQOciApmContext here = os.path.dirname(os.path.realpath(__file__)) def run_main(): with HiQOciApmContext( service_name="hiq_doc", span_name="main_driver", ): _ = hiq.HiQLatency(f"{here}/hiq.conf") hiq.mod("main").main() if __name__ == "__main__": os.environ["TRACE_TYPE"] = "oci-apm" run_main()To view the performance in Oracle APM with HiQ, you just need to:
Set environment variable
TRACE_TYPE
equal tooci-apm
(Line 18)Create a
HiQOciApmContext
object usingwith
clause and put everything under its scope (Line 10-12)Run this code and check APM trace explorer in the web console.
We got a 4-span trace! Click
hiq_doc: main_driver
and we can seeTrace Details
page:HiQ with Flask and OCI APM
HiQ can integrate with Flask and OCI APM by class
FlaskWithOciApm
in a non-intrusive way. This can be used in distributed tracing.
1 2 3 4 5 6 7 8 9 10 11 12 13 14 15 16 17 18 19 20 21 22 23 24 25 26 27 28 29 30 31 32 33 34 35 36 37 38 import os import time from flask import Flask from flask_request_id_header.middleware import RequestID from hiq.server_flask_with_oci_apm import FlaskWithOciApm def create_app(): app = Flask(__name__) app.config["REQUEST_ID_UNIQUE_VALUE_PREFIX"] = "hiq-" RequestID(app) return app app = create_app() amp = FlaskWithOciApm() amp.init_app(app) @app.route("/", methods=["GET"]) def index(): time.sleep(2) return "OK" @app.route("/predict", methods=["GET"]) def predict(): time.sleep(1) return "OK" if __name__ == "__main__": host = "0.0.0.0" port = int(os.getenv("PORT", "8080")) debug = False app.run(host=host, port=port, debug=debug)All the endpoints requests information will be recorded and available for analysis in APM.
HiQOpenTelemetryContext
The second way to send data to OCI APM is to use
HiQOpenTelemetryContext
, which leverage OpenTelemetry api under the hood.For the same target code, the driver code is like:
1 2 3 4 5 6 7 8 9 10 11 12 13 14 15 16 import hiq import os from hiq.distributed import HiQOpenTelemetryContext, OtmExporterType here = os.path.dirname(os.path.realpath(__file__)) def run_main(): with HiQOpenTelemetryContext(exporter_type=OtmExporterType.ZIPKIN_JSON): _ = hiq.HiQLatency(f"{here}/hiq.conf") hiq.mod("main").main() if __name__ == "__main__": run_main()Note
OCI APM doesn’t support Protobuf metrics data for now. Only Json format data via HTTP is supported. So OtmExporterType.ZIPKIN_JSON is required in line 10 above.
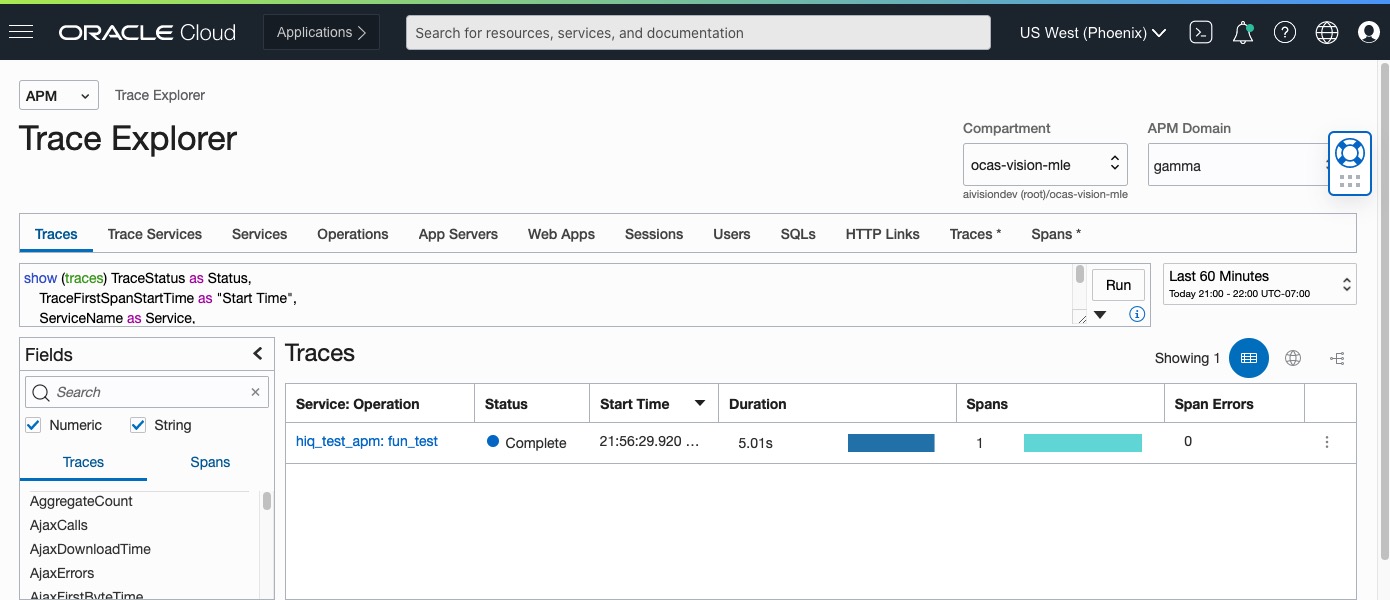
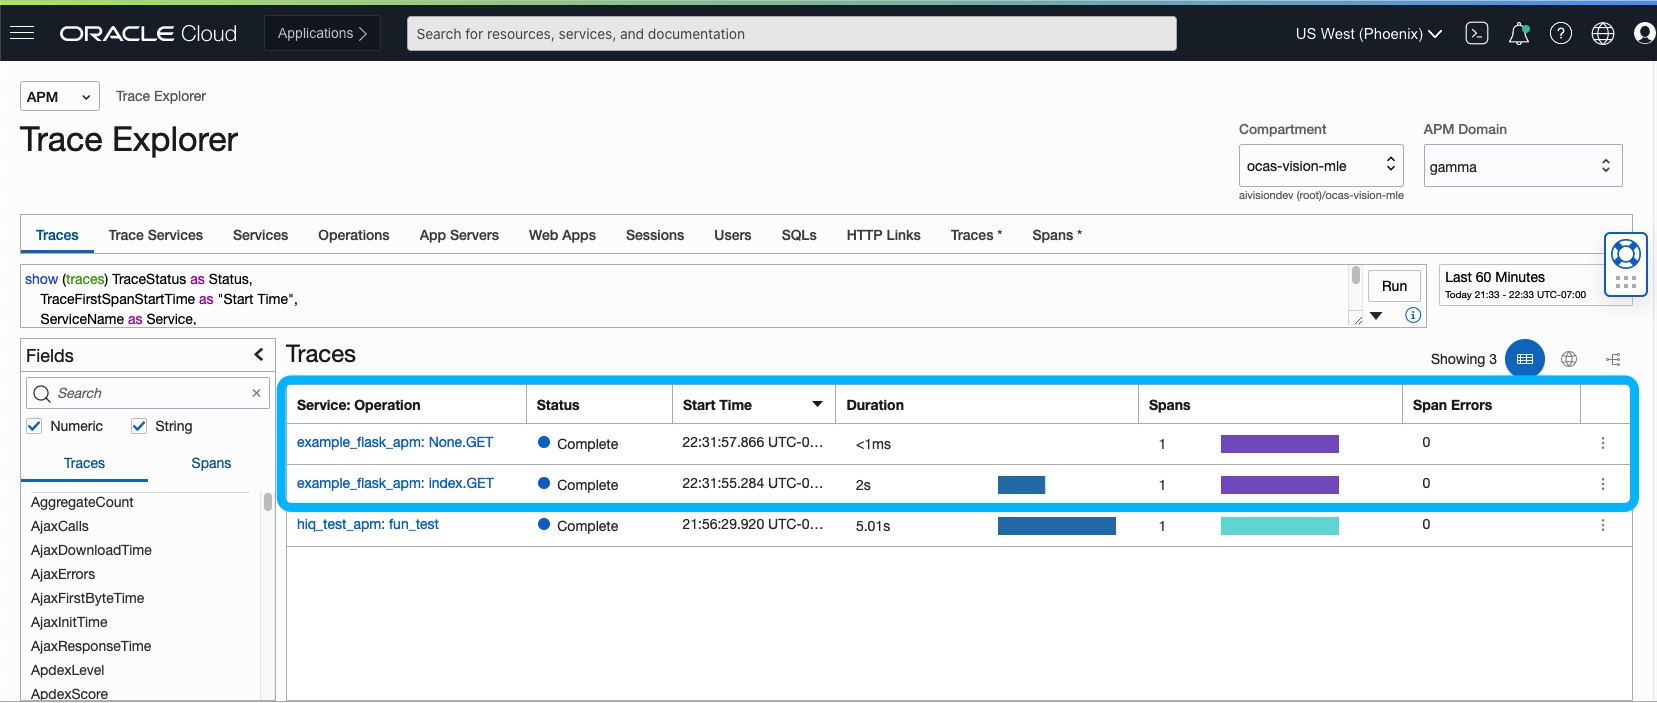
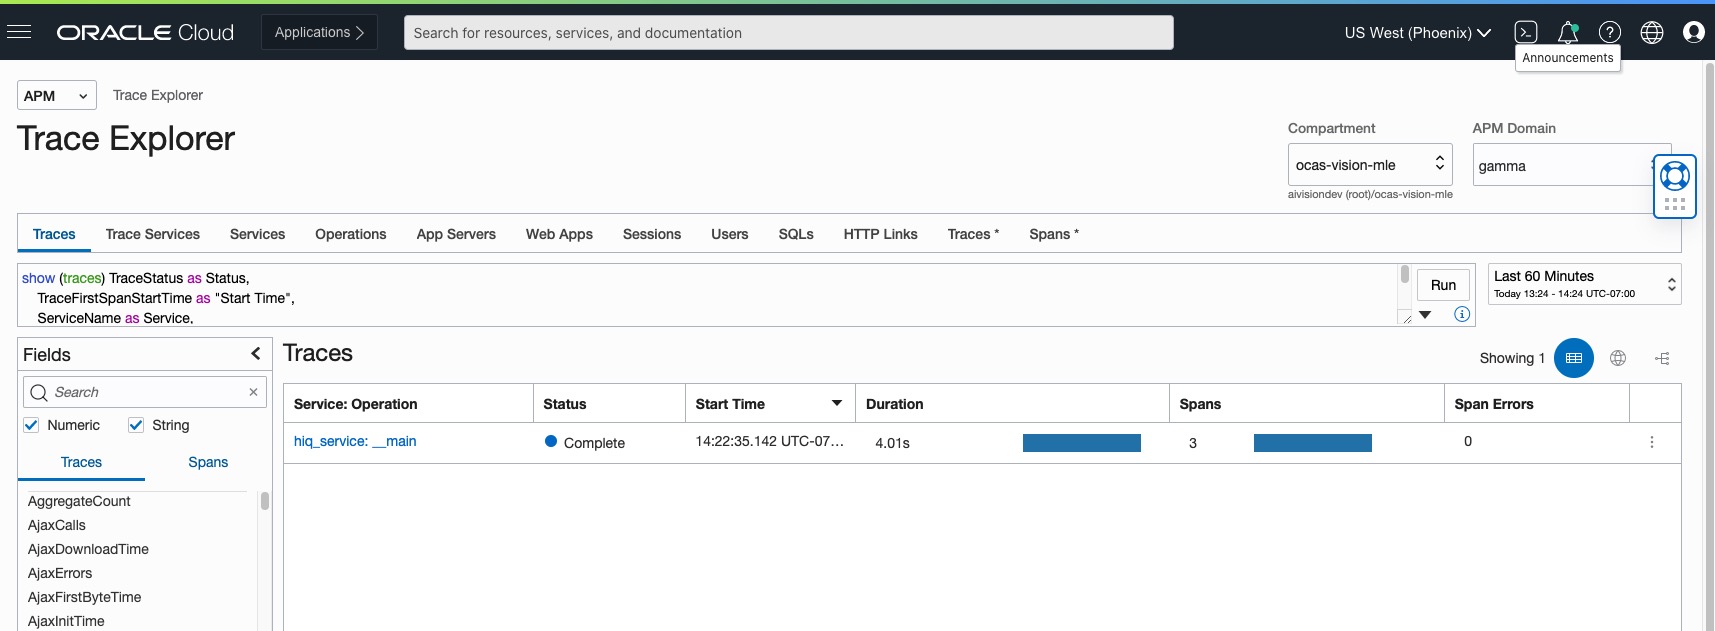
Run the driver code and go to the OCI APM web console, we can see:
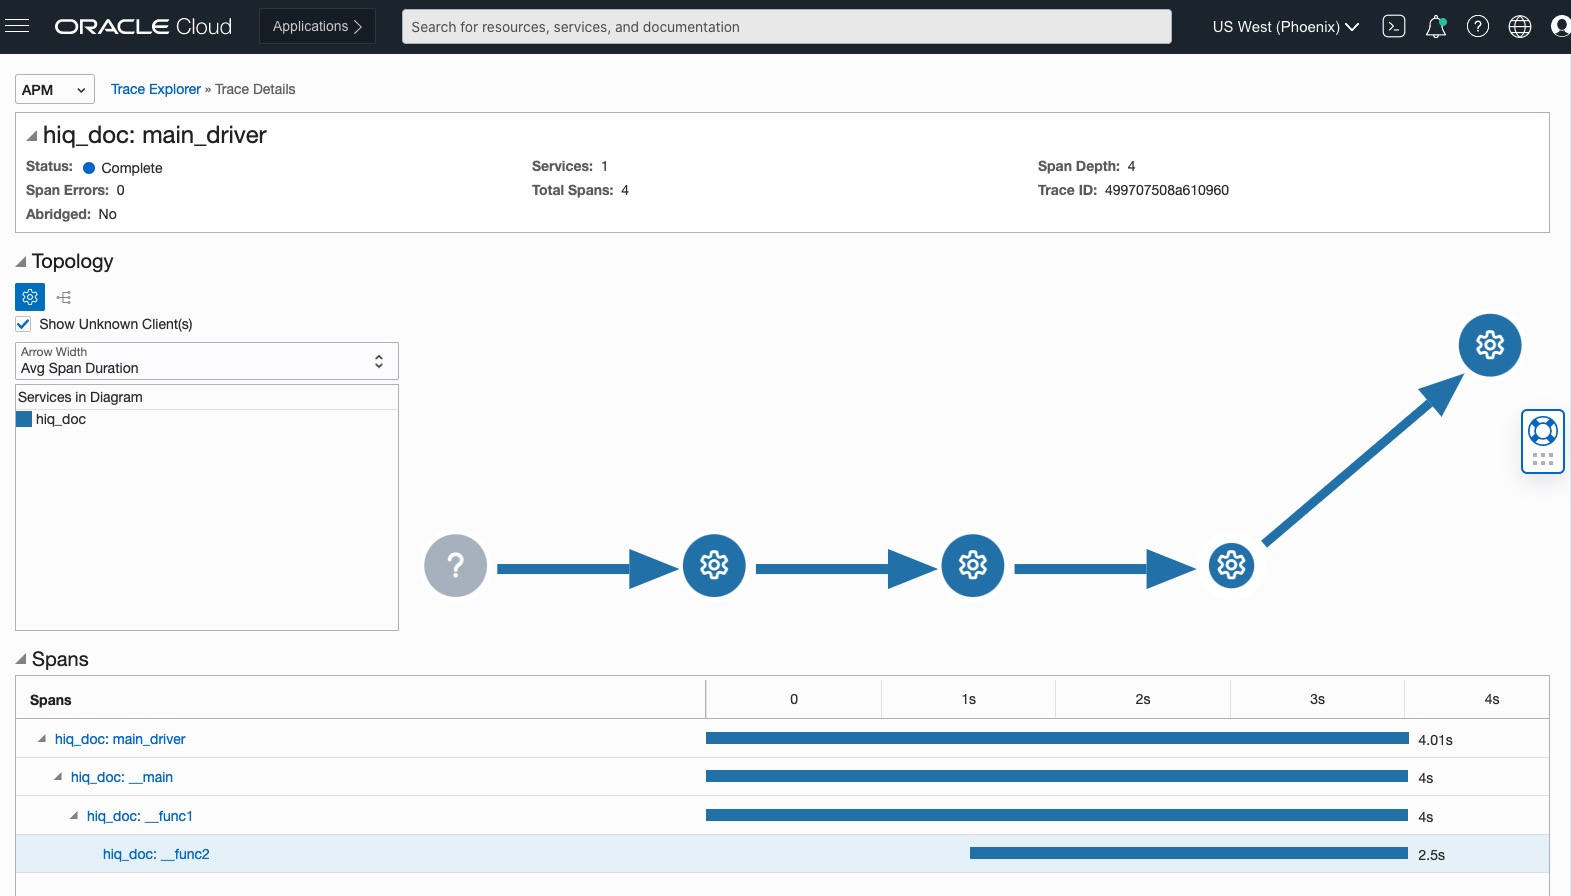
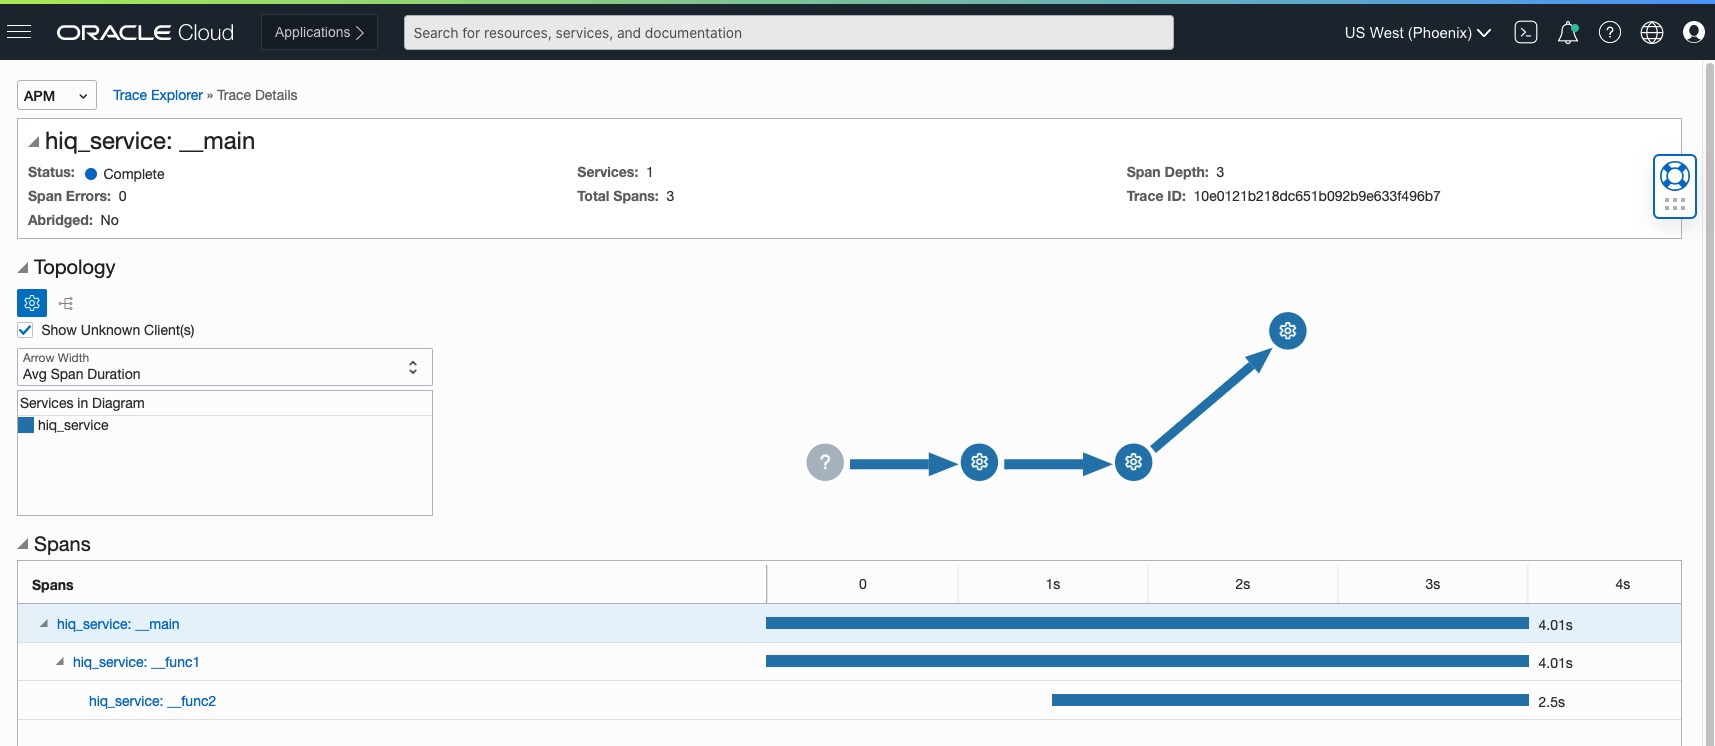
Click
hiq_service: __main
, we can see the trace details:Reference
OCI Functions
First you need to add
hiq
in therequirements.txt
:
1 2 fdk>=0.1.39 hiqWe can easily send metrics data to APM inside an OCI function like below:
1 2 3 4 5 6 7 8 9 10 11 12 13 14 15 16 17 18 19 20 21 22 23 24 25 26 27 28 29 30 31 32 33 import io import json import logging import os import hiq from hiq.distributed import HiQOpenTelemetryContext, OtmExporterType from fdk import response here = os.path.dirname(os.path.realpath(__file__)) def run_main(): with HiQOpenTelemetryContext(exporter_type=OtmExporterType.ZIPKIN_JSON): _ = hiq.HiQLatency(f"{here}/hiq.conf") hiq.mod("main").main() def handler(ctx, data: io.BytesIO = None): name = "World" try: run_main() body = json.loads(data.getvalue()) name = body.get("name") except (Exception, ValueError) as ex: logging.getLogger().info("error parsing json payload: " + str(ex)) logging.getLogger().info("Inside Python Hello World function") return response.Response( ctx, response_data=json.dumps({"message": "Hello {0}".format(name)}), headers={"Content-Type": "application/json"}, )OCI Function is normally memory constrained. So you can use
HiQMemory
to replaceHiQLatency
above to get the memory consumption details.OCI Telemetry(T2)
The Oracle Telemetry (T2) system provides REST APIs to help with gathering metrics, creating alarms, and sending notifications to monitor services built on the OCI platform. HiQ integrates with T2 seamlessly.
OCI Streaming
The OCI(Oracle Cloud Infrastructure) Streaming service provides a fully managed, scalable, and durable solution for ingesting and consuming high-volume data streams in real-time. Streaming is compatible with most Kafka APIs, allowing you to use applications written for Kafka to send messages to and receive messages from the Streaming service without having to rewrite your code. HiQ integrates with OCI streaming seamlessly.
To use OCI streaming you need to install oci python package first:
pip install ociThen set up OCI streaming service and create a stream called
hiq
for instance. Please refer to OCI Streaming Document for how to set them up.The target code is the same as before, and the following is the sample driver code:
1 2 3 4 5 6 7 8 9 10 11 12 13 14 15 16 17 18 19 20 21 22 23 24 25 26 27 28 29 30 import os import hiq from hiq.hiq_utils import HiQIdGenerator here = os.path.dirname(os.path.realpath(__file__)) def run_main(): with hiq.HiQStatusContext(): driver = hiq.HiQLatency(f"{here}/hiq.conf", max_hiq_size=0) for _ in range(4): driver.get_tau_id = HiQIdGenerator() hiq.mod("main").main() driver.show() if __name__ == "__main__": import time os.environ["JACK"] = "1" os.environ["HIQ_OCI_STREAMING"] = "1" os.environ[ "OCI_STM_END" ] = "https://cell-1.streaming.us-phoenix-1.oci.oraclecloud.com" os.environ[ "OCI_STM_OCID" ] = "ocid1.stream.oc1.phx.amaaaaaa74akfsaawjmfsaeepurksns4oplsi5tobleyhfuxfqz24vc42k7q" run_main() time.sleep(2)Due to the high latency of Kafka message sending, we process the metrics in the unit of HiQ tree in another process
Jack
. What you need to do is to set the environment variablesJACK
andHIQ_OCI_STREAMING
to1
like line 20 and 21, and also the streaming endpoint(OCI_STM_END
) and streaming OCID(OCI_STM_OCID
) with the information from your OCI web console.
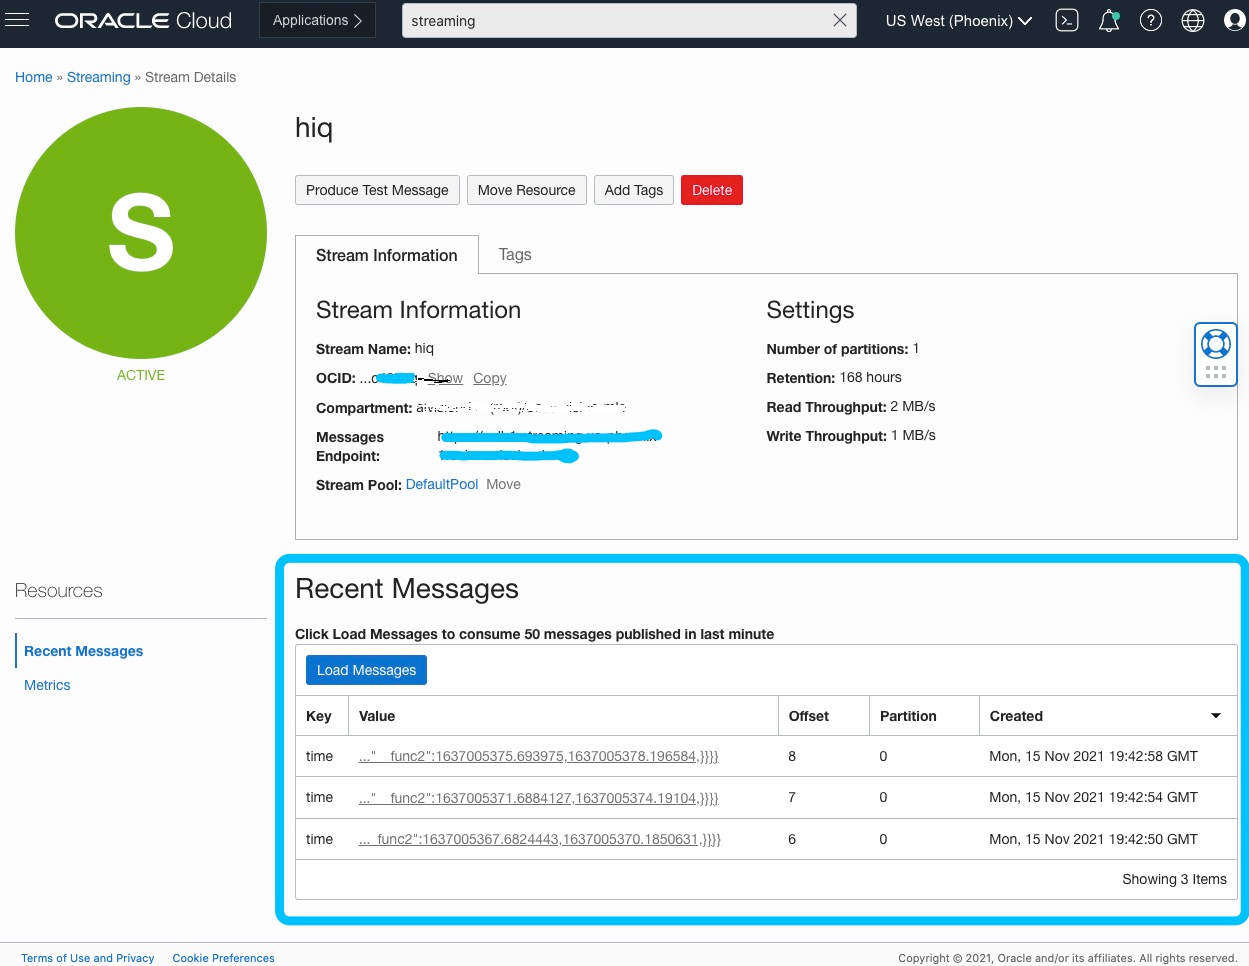
Run the driver code and then go to OCI web console, you can see the HiQ trees have been recorded.
Prometheus
Prometheus is an open-source systems monitoring and alerting toolkit originally built at SoundCloud, now a CNCF (Cloud Native Computing Foundation) project used by many companies and organizations. Prometheus collects and stores its metrics as time series data, i.e. metrics information is stored with the timestamp at which it was recorded, alongside optional key-value pairs called labels. If the targe code/service is a long running service, Prometheus is a good option for monitoring solution. HiQ provide an out-of-the-box solution for Prometheus.
Like the other integration methods, you need to set environment variable
TRACE_TYPE
. To enable prometheus monitoring, you need to set it toprometheus
.Up to your performance SLA, you can call
start_http_server
from the main thread or, for better performance, you may want to use pushgateway but that involves more setup and operation overhead.The following example shows how to expose Prometheus metrics with HiQ.
1 2 3 4 5 6 7 8 9 10 11 12 13 14 15 16 17 18 19 20 21 22 23 24 import hiq import os import time import random from prometheus_client import start_http_server here = os.path.dirname(os.path.realpath(__file__)) def run_main(): with hiq.HiQStatusContext(): start_http_server(8681) count = 0 while count < 10: with hiq.HiQLatency(f"{here}/hiq.conf") as driver: hiq.mod("main").main() driver.show() time.sleep(random.random()) count += 1 if __name__ == "__main__": os.environ["TRACE_TYPE"] = "prometheus" run_main()
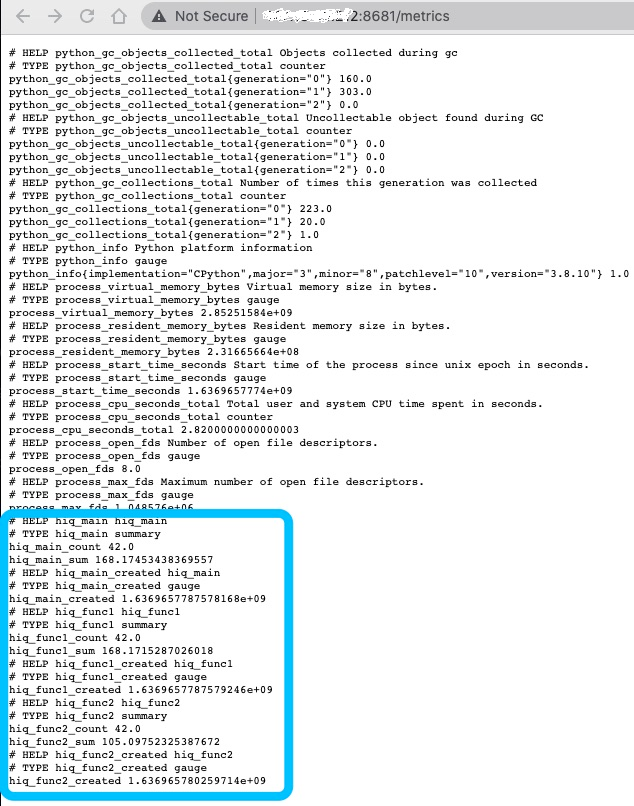
Run the driver code and visit
http://localhost:8681/metrics
, and we can see the metrics has been exposed. Please be noted that the metrics name has anhiq_
as the prefix so that the metrics name is unique.We can see the summary of
main
,func1
,func2
exposed. If the prometheus server is running in the same host, you can add the config in prometheus.yml to scrape the metrics for user to query.- job_name: "hiq" static_configs: - targets: ["localhost:8681"]