FAQ
HiQ vs cProfile
cProfile is a built-in python module that can perform profiling. It is the most commonly used profiler currently. It is non-intuitive and has wide support by third party modules.
We still use the same target code, and the driver code could be like this:
1 2 3 4 5 6 | import cProfile import hiq with cProfile.Profile() as pr: hiq.mod("main").main() pr.dump_stats("result.pstat") |
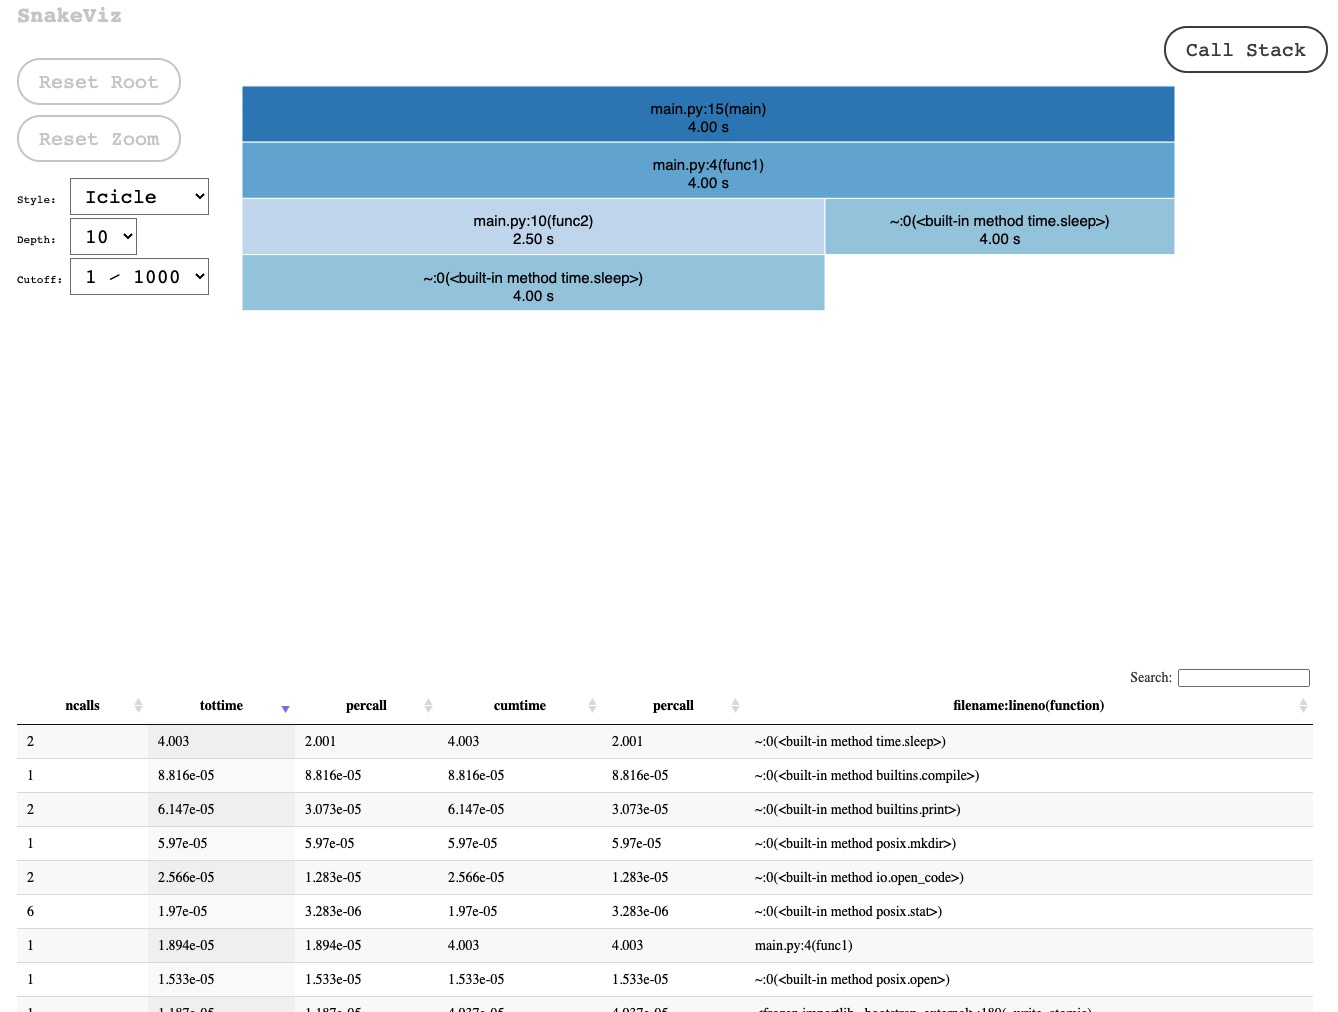
Running this will generate a stats file called result.pstat. We can use tools like snakeviz to analyze the result. SnakeViz is a browser based graphical viewer for the output of Python’s cProfile module and an alternative to using the standard library pstats module. SnakeViz is available on PyPI. Install with pip:
pip install snakeviz
Then simply run the command:
snakeviz result.pstat
A web browser will start and you can view the result like:
cProfile is based on c module lsprof (_lsprof.c) so it is very high performant in term of program execution. I even use cProfile to profile HiQ sometimes with small target code for development purpose.
However, it has many drawbacks:
High Overhead: cProfile measures every single function call, so for program which has many function calls, it has high overhead and distorted results.
Overwhelming Irrelevant Information: cProfile outputs too much information which is irrelevant to the real problem.
Useful for Offline Development Only: Quite often your program will only be slow when run under real-world conditions, with real-world inputs. Maybe only particular queries from users slow down your web application, and you don’t know which queries. Maybe your batch program is only slow with real data. But cProfile as we saw slows do your program quite a bit, and so you likely don’t want to run it in your production environment. So while the slowness is only reproducible in production, cProfile only helps you in your development environment.
Function Only and No Argument Information: cProfile can tell you “slowfunc() is slow”, where it averages out all the inputs to that function. And that’s fine if the function is always slow. But sometimes you have some algorithmic code that is only slow for specific inputs. cProfile will not be able to tell you which inputs caused the slowness, which can make it more difficult to diagnose the problem.
Difficult to Customize: cProfile is designed to be a handy tool. You can write plugin with different cost functions, but that is not enough in many cases. It is not easy to customize.
HiQ, on the other hand, has low overhead and make it always transparent to users. It give users the option of which function to trace. With the zero span node filtered, the HiQ tree is even more concise and you can find the bottleneck at the first glance. It is fully customizable, fully dynamic. It is designed for production environment, so you can use HiQ in both production and development environment.
HiQ vs ZipKin vs Jaeger
HiQ can be used for both monolithic application and distributed tracing. HiQ can integrate with Zipkin and Jaeger and empower them with declarative, non-intrusive, dynamic and transparent distributed tracing.
HiQ vs GaalVM Insight
GraalVM Insight is able to trace information for all GraalVM languages (JavaScript, Python, Ruby, R) in a non-intrusive way with minimum overhead. However, it requires GraalVM installed, and it also suffers from compatability issue with third-party libraries like numpy.